Search the Community
Showing results for tags 'coastdown'.
-
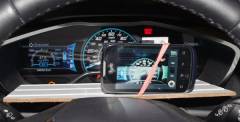
Decided to try a coastdown test on The Enterprise. I could not believe how long it takes to coast to a stop! I was sure the motor was pulling a bit as the car went on and on. But no, after stopping, there was no pull until shifting back to Drive. Here's my setup for taking data. Phone with rubber band holding it to a metal L bracket attached to some paneling. Very stable videos. PROCEDURE: Find a flat road with no wind (or cars!), start the video, speed up to just over starting speed, shift to Neutral, coast for two miles (yes, it takes at least two miles just to coast!) , stop video. Repeat in other direction. Do it several times, etc. (Kept passing some guy on a bicycle. Figured he was wondering what that nutcase driver was doing but he didn't seem to pay much attention.) Anyway, go home, play all the fool videos and use a stop watch to get all the splits every 5 mph. Enter data, average the runs and adjust the Crr (coefficient of rolling resistance) and Cd (coefficient of drag) to get the equation below to fit the averages. I had 4 good runs (2 each way) with tires at 49 psi cold and then did 2 more (1 each way) after letting out 11 psi. Tire pressure had only gone up 2 psi from "cold" so actually dropped pressure to 40. Air temperature was about 76F. Here's the data (seconds) and resulting fits. Odd runs in one direction, even in the other. ---------------------49 PSI Cold ----------------------- ---------- 38 PSI Cold-------- Speed Run 1 Run 2 Run 3 Run 4 Fit to Avg Run 5 Run 6 Fit to Avg 70 0 0 0 0 0 0 0 0.00 65 6.17 6.73 5.98 6.97 6.95 5.69 6.65 6.84 60 14.37 14.98 13.8 15.21 14.72 12.61 14.54 14.49 55 22.27 23.6 22.31 24.35 23.47 21.98 23.67 23.07 50 31.89 34.48 32.21 34.37 33.33 31.57 34.09 32.72 45 42.1 45.17 41.1 46 44.50 38.92 45.71 43.63 40 55.28 59.14 53.16 60.7 57.18 51.06 61.75 55.96 35 69.23 74.2 67.23 74.38 71.59 65.78 76.32 69.92 30 85.42 92.02 82.48 91.84 87.94 81.07 94.55 85.72 25 103.12 109.48 98.63 108.83 106.45 95.19 113 103.50 20 122.99 131.8 119.07 133.12 127.23 113.25 134.63 123.37 15 146.28 156.81 141.49 157.87 150.28 133.36 157.2 145.31 10 170.27 183.73 166.91 182.62 175.38 157.03 179.82 169.10 5 190.55 205.48 183.81 200.85 202.07 177.57 198.03 194.32 Results for 49 psi: Crr = 0.0082, Cd = 0.29 Results for 38 psi: Crr = 0.0087, Cd = 0.29 Equation was: a = -(Cd*A*0.5*rho*V2)/M - Crr*g where: a = acceleration in m/s2 A = frontal area (I used a rough estimate of 2.60 sq-m but need a better number) rho = air density = 1.22 kg/m3 (might not be quite right for actual temperature and pressure) V = velocity in m/s M = mass of car & "contents" in kg (I used 1740) g = Standard gravity = 9.81 m/s2 (All the above subject to corrections! Plus a better equation would take rotational friction into account which is proportional to speed - not speed squared. However, I had all the above stuff from a spreadsheet where I did the Lexus years ago. It had a Crr of 0.012 and Cd of 0.35.) But I'm glad we don't have to worry about all this to have fun driving the awesome C-Max! :shift:
-
From the album: SS
Setup for video recording coastdown test.


