


plus 3 golfer
-
Posts
2,688 -
Joined
-
Last visited
-
Days Won
356
Content Type
Profiles
Forums
Gallery
Everything posted by plus 3 golfer
-
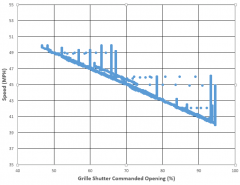
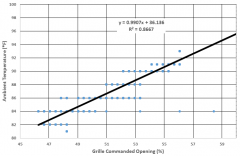
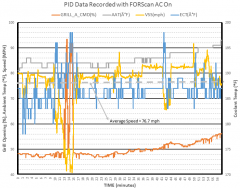
Here's recorded operating data on the grille shutters from my recent trip . There were over 102 k observation taken with rising ambient air temperature from 81 F to 93 F over nearly 58 minutes with AC on. The data was recorded traveling I-20 W starting between Weatherford TX and Abilene TX. Although I couldn't record Transmission Fluid Temperature with the current release of FORScan at the same time with grille shutter data, I can say that when recording TFT under similar driving conditions, TFT was never above 176 *F. TFT usually stayed around 30F under Engine Coolant Temperature which means TFT usually ran between about 155-165*F. I have to review more recorded data and may start another thread on it. "The grille shutter moves 90 degrees from fully closed to fully open and based on the position commanded by the PCM is set in 1 of 16 positions (approximately 6 degrees between positions)...."The PCM communicates the desired position (open or closed) of the grille shutter based on various PCM inputs (vehicle speed, coolant temperature, ambient temperature, A/C system pressure, etc.). " The first graph shows four of the variables recorded. The PIDs are: GRILL_A_CMD (%) - This is the commanded opening % for the grill shutters. There is also an inferred grill shutter open % PID also. I assume this is a sensor reporting back to the PCM. The inferred position tracks the commanded opening but can be a few % points slightly higher or lower than the commanded positions. I assume this is because the shutters move in steps of about 6.7% (6*/90*). ECT(°F) - Engine Coolant Temperature. AAT(°F) - Ambient Air Temperature VSS(mph) - Vehicle Speed Sensor A couple of observation were noted:1) there was a correlation between commanded position and ambient air temperature and 2) speed affected commanded position. The next graph shows commanded position vs speed above 60 mph. I also graphed (with trend line) for speeds above 70 mph and for speeds above 50 mph. The trend line equation for above 70 mph was virtually the same as above 60 mph. But, for the trend line equation for above 50 mph correlation dropped. R^2 dropped to 82% (from 87% for data above 60%)and the slope dropped from the 0.99 (virtually one degree ambient temperature change equaled one percent change in commanded shutter position for speeds above 60 mph) to 0.95. So, It appeared from the first graph that speed was having more of an influence on shutter position under 50 mph (minutes 13 to about 15 on first graph). So, I graphed speed under 50 mph vs grille shutter position shown in the last graph. The graph clearly shows that speed is likely the driving variable to shutter position under 50 mph with AC on with the ambient temperatures being experienced.
-
From the album: Plus 3 Golfer
-
From the album: Plus 3 Golfer
-
From the album: Plus 3 Golfer
-
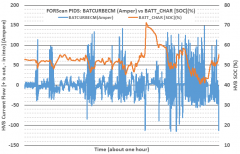
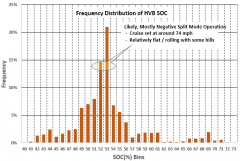
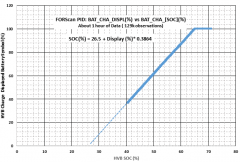
I used my Smartphone and FORScan Lite for Androids continuously on my recent 4500 mile trip. I recorded lots of data nearly 20 hours worth (likely will never look at most of it). Here's some of it in graphical form plus some comments. I will add more as I look at the data. The data below was recorded on I-20 W between Monroe and Shreveport, LA. FORScan worked fine except occasionally the streaming of data would stop. Sometimes simply restarting the scanning of the module worked but other times I had to reconnect to the adapter (used WIFI and Bluetooth with similar results). The frequency of occurrence seemed to be module dependent (I guess I could look at the error logs and find out), Some modules I continually scanned for over an hour with no problems. On others the streaming of data would stop after several minutes. The following graph shows the HVB SOC vs the dash battery symbol % state of charge. As we know the battery symbol represents the usable range of the HVB. The graph shows that when the battery symbol shows a "fully charged" HVB, the HVB is only about 65+% charged. Note that the highest observed SOC was about 71% The next graph shows the distribution of the SOC during the one hour of data recording. The last graph shows the HVB SOC and HVB current flow. Note the beginning part of the graph where the current flow is less than 10 A and the SOC is virtually flat at about 53%. During this time ICE is running and the battery symbol carrat (arrow) would sometimes show charging, sometimes show charge depleting, and sometimes there would be no arrows. This IMO is negative split mode operation. Speed was about 74 mph . FE was around 36+ mpg (97 F maybe a 10 mph frontal quartering wind).
- 1 reply
-
- 4
-

-
From the album: Plus 3 Golfer
-
From the album: Plus 3 Golfer
-
From the album: Plus 3 Golfer
-
I forgot the Energi's final drive ratio is numerically higher than the Hybrid. IIRC the Hybrid is 2.57:1 and the Energi is 2.91. :) It's hard to make up $7k in fuel savings between an Energi and Focus. I couldn't justify an Energi over my Hybrid when I purchased my Hybrid in Dec. 2012 for a $2.3k difference even charging once a day every day on about 15k miles a year. Simple payback was over 10 years.
-
Ford's Road Load Horsepower coefficients (generally based on coast down data) result in dynamometer settings that will yield lower EPA FE for the Energi than the Hybrid after running the various EPA test cycles. Like you say the only difference between the two models is weight. The graph below shows the RLHP for several cars.
-
About to buy a NEW 2013 C-Max Hybrid today
plus 3 golfer replied to KashmirSwimsuit's topic in Buying, Order and Leasing
Correct as I've said but again a quick scan shows maybe a handful of states that provide such state tax credits for PHEVs. Here's a link for the curious to the most up to date list I could find of the "benefits" states offer to AFV including PHEVs (sometimes). -
About to buy a NEW 2013 C-Max Hybrid today
plus 3 golfer replied to KashmirSwimsuit's topic in Buying, Order and Leasing
Not the case now which is what we should be talking about not some "special" MY end incentives to dump cars. The 2015 Hybrid currently has a $1,500 Customer Cash (PGM #12768) incentive that is not available on the Energi in AZ and my guess in virtually all states (not worth my time to check). The around $4000 FTC brings the Energi down to within several hundred $ of the Hybrid. So, all other things being equal, the Energi is around $1800 more than the Hybrid. Add back the state sales tax on the price difference between the two and in AZ and a lot of other states the $1800 is over $2000. Convincing requires supported facts. ;) :) So, unless one's state has incentives on PHEVs, I doubt one can buy an Energi for near the same price as the Hybrid all other things being the same at this time. -
About to buy a NEW 2013 C-Max Hybrid today
plus 3 golfer replied to KashmirSwimsuit's topic in Buying, Order and Leasing
I'm not sure I follow what you are doing / trying to say as there is more than fuel saving. There is the original price difference to make up plus the Energi will get less FE when in Hybrid mode than the Hybrid. I looked very hard as to whether the Energi made economic sense to me in December 2012 when I bought my SEL Hybrid as I really wanted one. But, it didn't as my out-of-pocket cost for the Energi would have been over $2300 more than the Hybrid and the simple payback would exceed 10 years. My current numbers are not much better (see below) My calculation show that for my driving with no intra-day charging, 120 V charging station, $0.086 per kWh, $2.62 per gallon for gas I could possibly drive 6000 EV only miles out of 15000 annual miles and save about $190 per year in energy cost. If gas goes to $4.00 per gallon, the saving might double to $380 per year. So, for about a $1800 cost difference between the 2015 Energi and Hybrid SEL after Federal tax credit credit and cash incentives (AZ had no state tax incentives), the simple payback is over 9 years or about 135,000 miles. At $4 per gallon, the payback is about cut in half. But that is still way to long for me and besides I'm not sure the Phoenix area ever saw $4 gas. :) Of course for states with PHEV incentives, the payback could be shortened considerably. -
No, it's referring to the evaporator core inside the HVAC box under the center of the dash. Evidently there's a faulty temp sensor which is incorrectly reporting the evaporator core temperature higher than actual. So, the AC compressor continues to operate lowering the evaporator core temperature too low which then freezes the condensation on the core. Ice forms and continues to build on the core restricting air flow through the core.
- 29 replies
-
- 1
-
-
- TSB 14-0220
- TSB
- (and 2 more)
-
Consumer Reports C-max review and reliability data
plus 3 golfer replied to djc's topic in Articles, News & Reviews
EXACTLY. Yes, CU always liked the C-Max. CU questioned the EPA FE as did many reviewers (which many on this forum took issue with). We know now CU was right on the FE as Ford eventually tested the C-Max per the EPA regs and also found an error in the road load HP coefficients. Also, anyone that follows this forum and researched how CU uses the consumer data on issues should quickly realize what the major issues were that affected reliability and what CU's circle ratings really mean. A black circle doesn't mean owners will likely have the issue. The circle ratings represents the relationship between the "average" car and the C-Max. In simple terms all other things being the same, it might mean that if the average car has 1 issue / 100 vehicle, a car with 1.8 issues / 100 might get a solid black circle and a rating of expected reliability of 80% less than average because the car with 1.8 issues / 100 compared to all vehicles is farther away from the average than a significant portion of all vehicles. CU has also stated that as the reliability of vehicles continues to improve the differences in a solid red circle ratings and average and a solid black circle rating and average may be small. -
FORScan Lite for Androids Released 6/29/2015
plus 3 golfer replied to plus 3 golfer's topic in General Discussion
Good to know but I've asked questions on Palmer Engineering forums on DashCommand and got similar responses to similar questions. AFAIK, DashCommand still lacks features that would be nice like ability to add custom PIDs to iOS devices (although I haven't checked in months since I switched to Android). I do agree with FORScan though that custom PIDs for FORScan is likely not needed but the ability to put any PID from modules on the same bus on a single dashboard is IMO "almost" a must have (but for a cost of $5 I can live without it :)). -
FORScan Lite for Androids Released 6/29/2015
plus 3 golfer replied to plus 3 golfer's topic in General Discussion
IMO, Apps like Torque Pro (which I have) are "generic" and thus are not up to date with respect to DTC and sensor data for each car manufacturer and the various control modules. These Apps also IMO have a lot of "useless" (to me :) ) calculated data like trip and performance data to make them appear "very" robust. Torque Pro does allow for custom PIDs though. So, if one has the PIDs, the PIDs can be entered and one might be able to approach FORScan in data availability. The problem is I have yet to see a comprehensive list of PIDS for the various control modules specific to the C-Max. AFAIK (although I haven't tested every PID), FORScan has all the Hybrid PIDs that I've seen listed in other threads (and many more that I've not seen). I assume these PIDs work. This is not to say FORScan doesn't have errors. For example, the ambient temperature dashboard gauge show the digital temperature but the dial scaling is in error as the maximum is below the reading. Since one cannot access the pre-programmed PIDs, this will likely be fixed in subsequent releases. AFAIK there is no way to enter custom PIDs. I assume that since all PIDs for Ford products would be included in the FORScan data base, there is no need for custom PIDs. You can get on the FORScan forum and ask questions about the PIDs and applicability to the C-Max Hybrid. I just don't have the time (nor do I see a need to) check off every PID shown in all the modules and view in tabular or dashboard form to see if the PIDs work. FORScan also has PIDs for the status of devices like control valves, switches and so forth and much more data. There certainly could be "bad" PIDs which I assume would be corrected in later releases. One other issue with FORScan is that I haven't found a way to stream and display data from several modules on the same dashboard. So, if one wants to monitor tire pressure and TFT (two different modules), one has to switch the display to the appropriate module. This requires stopping the scan of the current module, selecting the new module from a list of modules to scan, and starting the scan of the new module. Then one's pre-selected PIDs of the new module will now be displayed. It's somewhat of a pain to switch back and forth among modules which is why I have my smartphone mounted just left of the steering wheel for very easy access. -
FORScan Lite for Androids was released on 6/29/2015. I have been using the free trial version for about 6 weeks or so. The cost of the new released version for sale is less than $5. As I've said before this IMO is the best OBDII scanner for the price primarily because it's specifically for Ford group vehicles. It scans virtually all the vehicles modules for DTC and allows streaming of module specific data that can be displayed on a graph, dash board, or table. Here's an example, one can monitor the left and right front ABS pressure sensors. In preliminary testing, I wanted to see if I could use this data to apply the maximum brake pressure and still score 100% brake score. There was a post / thread very early on where someone wanted an indication of how much brake pedal could be used before friction braking took over and reduced the brake score. The nominal brake pressure readings were under about 7 psi cruising (probably sensor variability). I began to depress the brake pedal to slow down. If the pressure sensor reading didn't change, I scored 100% brake score. As I pressed the brake pedal harder, there was a point where the pressure reading jumped to mid teens PSI. I could not "feel" that the friction brakes were applied. The brake score was 96%. Also, on my very recent 4k+ trip back East, I continually monitored TFT, ECT, Traction Motor Coil Temperature, ambient temperature, speed, tire pressure and several other sensors. For viewing the data while driving, I have a Ram mount system with suction cup (larger one) and extension arm mounted on the driver's side window that brings my smartphone about to the steering wheel. This makes viewing and operate the smartphone very easy. The Ram system is "rock solid" and costs around $50. Here's link to FORScan.org
-
My 2 cents. I've experienced what appears to be a reduction in braking in sharper turns when slowing down when I first started drving my C-Max. I'm going to pay more attention to it as I'm used to the braking feel of my C-Max now and haven't paid attention to it anymore. Very early on I attributed this reduction in braking to use of ABS when turning to apply proportional friction braking to rear and perhaps front wheels when in regeneration. I've posted this post about 2 years ago about control strategies using regenerative braking. We don't know what strategies Ford uses but IMO it's likely that the traction motor and ABS are used together under certain conditions. My theory is that at some point in the braking process when slowing down in curves ABS discontinues use of the friction brakes but regenerative braking continues. One feels a slight surge (decelleration slows) when use of friction braking ceases or perhaps a combination of friction / traction motor braking forces are changed. For me this is has not been an issue. Again in the papers the goal is to maximize regeneration efficiency but in a safe, controlled way to simulate friction braking. There are likely slight anamolies under certain condtions when trying to integrate traction motor and friction braking.
-
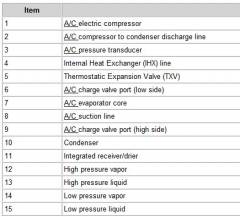
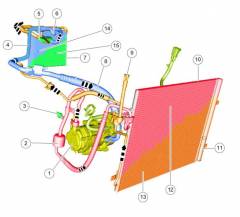
Where is the Low Pressure AC Port / Valve?
plus 3 golfer replied to cmax-nynj's topic in Climate Control
See my post above. -
From the album: Plus 3 Golfer
-
Where is the Low Pressure AC Port / Valve?
plus 3 golfer replied to cmax-nynj's topic in Climate Control
Item 6 in snippet against firewall. Looks like you have to remove the engine cover at minimum to get to it. -
From the album: Plus 3 Golfer
-
I understand what you desire but you likely should have bought the Energi if a 1000 foot hill is a concern of yours. The quote above is very misleading as there are significant losses in converting PE to usable energy. ;) There are drag forces at play as the car coasts down the hill that have to be overcome which depletes energy. This energy is an easy calculation / estimate using EPA Road Load Horsepower coefficients, the downhill % grade and the speed descending the hill. There are energy conversion losses to go from rotational to electrical and back to rotational energy. My guess is these losses are in the 20 to 30% range: MG2 efficiency 0.92 * Inverter efficiency 0.95 * HVB efficiency 0.97 and again * MG2 efficiency 0.92 = 0.78 overall efficiency. Suffice it to say that 1000 foot elevation change will not yield 1.4 kWh of usable energy and it's certainly not free as it takes fuel to make it to the top of the hill. Since ICE has to generally runs going up hills, it may be more efficient overall to operate ICE at the most efficient point on the BSFC curve by charging the HVB. Bottom line it's not as simple to mark a hill like an EV+ location and simply use EV when one enters the hill location. Also, I really think that what would make sense with predictive logic for hills would be use through rolling hills where the elevation change was rather minor not 1000 feet. Again for those that have significant hills to climb and descend, an Energi might make more sense. Here's a thread to read. It appears that Valkraider captured about 60% of the potential energy of his Energi at the top of the mountain on his long descent down the mountain. Most of that would have been lost with the Hybrid.
-
Customer Satisfaction Program 15B04
plus 3 golfer replied to MichaelM's topic in Lounge: C-MAX Hybrid
Lifetime summary is still there with EV miles / regen miles / fuel use mpg. Don't know about the power down yet. Battery was tested and was okay. Our experience with car batteries after 9 years in AZ, is that the batteries last about 3-4 years in the Phoenix area. So, I'll likely need a new battery in the C-Max within a year or so. So, if I had low voltage because of the wire chaffing and my battery now failed after 2 1/2 years, I'd consider the failure "normal" due to AZ climate The starting voltage threshold might be as low as around 6 V (5.95 below). Once the car is started, the DTCs and voltage thresholds for different voltage systems are shown below. The 12 V battery voltage entry positions for most sensor monitoring OBD functions is 11 V, for more critical functions 8 V and for critical hybrid components 6 V. P0560: 5V power supply out of range (4.75V > x) OR (x > 5.25V) 3.3V power supply out of range (3.46V < x) OR (x < 3.13V) 1.5 V power supply out of range (1.57V < x) OR (x < 1.42V)P0562: Battery voltage when vehicle is running and in a torque producing state < 8.2V KAPWR voltage out of range (x > 19.0V) OR (x < 5.95V)P0563: Battery voltage too high> 19.0VP0A23: Generator sensor reference voltage out of range > 6V or < 4.50V for 500ms.P0A18: Motor current sensor reference voltage out of range > 6V or < 4.50V for 500ms.P1633 Voltage below 6.0V for 20 seconds, or 5 seconds during module self-test