


plus 3 golfer
-
Posts
2,688 -
Joined
-
Last visited
-
Days Won
356
Content Type
Profiles
Forums
Gallery
Everything posted by plus 3 golfer
-
It's likely won't be funny when the driver impeding traffic in the left lane gets a ticket even if driving the speed limit. Many state (probably 1/2) have codes like the AZ law: "B. On all roadways, a person driving a vehicle proceeding at less than the normal speed of traffic at the time and place and under the conditions then existing shall drive the vehicle in the right-hand lane then available for traffic or as close as practicable to the right-hand curb or edge of the roadway, except when overtaking and passing another vehicle proceeding in the same direction or when preparing for a left turn at an intersection or into a private road or driveway." The speed limit is irrelevant in this case If one is impeding the normal speed of traffic, they must drive in the right hand lane.
-
How does the CMAX transmission work?
plus 3 golfer replied to SPL Tech's topic in General Discussion
ICE is connected to the planet carrier not the generator which is connected to the sun gear. If the generator is held stationary and ice spins, the planet carrier and planet gears spin which causes the ring gear to spin which propels the car. For charging when the car moving at a constant speed, ICE speeds up which will now cause the sun gear and the generator to spin while the ring gear maintains its speed. -
Here's an excerpt from a previous post for a 4000 mile plus, door to door trip: "On the trip East I got overall 40.4 mpg - door to door with an average speed of 68.4 mph (gps miles / gps moving time). My average speed on interstates (about 1600 miles) was 72.3 mph. On the trip back home, I averaged nearly 74 mph on interstates mainly because I drove very little during darkness so I set eco-cruise about 1-2 mph higher. I also battled a strong quartering wind from MO into AZ and rain in AZ high country and my overall return mpg dropped to 38.3 mpg. Overall, door to door round trip, I averaged 69.1 mph and 39.2 mpg with me, wife, our black lab and luggage (maybe 450 - 475 pounds)." Here's the link to my original post including experience using grille covers and coolant temps.
-
A while back I posted a graph of a 42 mile trip taking a route with lower speeds, stops and so forth showing various data I recorded on the trip. On the way back, I took the faster route back which is actually shorter by 5 miles. Here's the summary of both: 42.2 miles, 19.9 EV miles, 55 min. 59 sec., 50.3 MPG; 45.2 MPH, 0.83 gallons of fuel 37.1 miles, 13.8 EV miles, 44 min. 42 sec., 44.7 MPG; 49.8 MPH, 0.83 gallons of fuel If my goal is to maximize FE, I'd drive the longer trip every time and get around 50.3 mpg at about 45.2 mph but if my goal is to save time, I'd take the higher speed trip but only get 44.7 mpg but I'd average 49.8 mph and save about 11 minutes (about 20% in time) due to the shorter distance and higher speed. Coincidentally, I used exactly the same amount of fuel on the outbound and return trip of 0.83 gallons. So, in this case the higher speed trip saved time and the fuel use (and cost) was the same as the slower speed trip. Our normal trips (3-5 times a week) are about 25 - 70 miles RT where taking the freeway vs side streets would result in virtually identical distances but time savings is significant when using the freeway. Of course the trips at higher speeds result in "poor" :) FE My point though is that one's FE highly depends on speed and if one wants to impress one can certainly alter their speed (just driving slower or finding alternate slower speed routes) and post "great" :) numbers . My driving style hasn't changed with our C-Max. I've always had FE in the back of my mind going back to my first diesel in 1976. But I don't sacrifice time for FE. Hence, our overall FE is right at 41.0 mpg (tank calculated) but would likely be close to 47 mpg if we stayed off the freeways around Phoenix.
-
I agree that $2 gas will likely change some(many) consumers' buying decisions. But what will the price of gas be in 2017 is the question. Also, automakers have to meet CAFE requirements in 2017. I believe these are the current requirements for passenger cars: TABLE I–3—MINIMUM STANDARD FOR DOMESTICALLY MANUFACTURED PASSENGER CARS (MPG) 2017 2018 2019 2020 2021 2022 2023 2024 202536.7 -38.0 -39.4- 40.9 42.7- 44.7- 46.8- 49.0- 51.3 So, unless new standards are adopted, manufacturers will have to meet these numbers irrespective of the price of gas.
-
C-Max Failed Emissions Test for Inspection Sticker
plus 3 golfer replied to darrelld's topic in General Discussion
Please find a code that illuminates the check engine light that an OBDII code reader can't read. We know there are many proprietary codes that an OBDII reader can't read. But that's not what this thread, JulieB and my post are about. ;) It's about failing emissions. -
C-Max Failed Emissions Test for Inspection Sticker
plus 3 golfer replied to darrelld's topic in General Discussion
Maybe I wasn't clear. OBDII compliant code readers will read codes that cause the Check Engine Light to illuminate which is what the discussion / my post is about. That's a requirement of an OBDII reader. If it can't read the those codes then it's not an OBDII reader. The discussion is not about reading modules and proprietary codes that do not set the Check Engine Light. One does not need a Ford VCM with the latest IDS to read codes that illuminate the check engine light. -
C-Max Failed Emissions Test for Inspection Sticker
plus 3 golfer replied to darrelld's topic in General Discussion
JulieB, OBDII readers can read all codes that illuminate the check engine light and set the appropriate emissions readiness bits (emissions monitor information) to not ready. So, it's not material that other non emission systems have faults and the OBDII reader can't read the codes that do not illuminate the check engine light. If the fault(s) that cause the CEL to illuminate are still present (apparently there is still one code after 250 miles of driving), the CEL will remain on, What is the code that will not clear? Does your ODBii reader show the "readiness bits"? If yes, what are the bits status? Are you still under the 3/36 B2B Ford Warranty? Also, the attachment shows the OBDII drive cycle. If you've driven 250 miles, you likely have completed the requirements of the drive cycle. Even if you did not complete the drive cycle, the dealer should complete the drive cycle to see if the codes clear and fix the problem if you are still under warranty. Ford OBD Drive Cycle.pdf -
The problem with using logic philosophically to define great is that it doesn't quantify the degree of greatness. There is no "measure" of the extent of the greatness. So one then looks at the context in which "great" was used. For me it's simple: when one quotes numbers and comparisons (upper 50s, lower 60s, 58, 55.6) like in the context of the post, "wasn't great" for me means "not as good as I usually do". All quoted FE numbers may be viewed as "great" compared to the EPA FE but that's not within the context of the post. I can relate to what Kelleytoons post is about yet it seems others have yet to grasp it and I agree with it. I will virtually always get better FE driving the same route than my wife does. She drives the car for 2 or 3 trips in a row and gets around 41 mpg (she drives with a heavier foot, higher speeds, and not as good a brake score as me). Then, I drive the car on virtually the same route and I get 42 maybe 43 mpg. Is 1-2 mpg difference worth consciously trying to adjust ones driving style. IMO, speed is the most critical factor in achieving high FE numbers. As I've said many time, I can get high 50's low 60's for the same trip if I stay off the freeways, coast to stops and so forth or mid to upper 40s if I drive at around 63-65 mph on the freeways. But that's not going to happen as saving time is more important to me than any fuel savings. Increasing FE by 1 mpg results in about $20 savings a year currently with diminishing returns as FE goes up (based on 17000 miles per year, $2 per gallon and 41 mpg). Even if we could get 51 mpg average, the savings would be about $160 a year but that will never happen. ;)
-
Agree with scootwood2. I think most people when referring to "coasting" means leaving the transmission in "D". Coasting in "D" -- foot off the gas pedal, the traction motor (MG1) and the generator (MG2) are spinning, ICE does not spin if energy can be stored in the HVB. If there is room in the HBV to store energy, the traction motor acts as a generator to simulate engine braking like in a conventional vehicle. This is know as regeneration where some of the kinetic energy of the moving vehicle is used to generate electric power for use / storage in the HVB. If the HVB is full, ICE spins and provides "normal" engine braking. Coasting in "N" -- foot off the gas pedal, the traction motor (MG1) and the generator (MG2) are spinning, ICE does not spin. There is no regeneration taking place. There is no engine braking. So, the $64 question is: is it more efficient to coast in D or N when coming to a stop? Since there are electrical related losses associated with regeneration, IMO it's more efficient to coast in N. But, given that coasting in N in normal driving in traffic may "excite" drivers behind you because one likely has to start coasting in N well before a stop, and thus it is not very considerate / practical. Then, the question becomes: is it more efficient to coast in D when coming to a stop for as long as one can or should one coast in D to maximize regeneration using the brakes? This is a little tougher question to answer. But I believe (and I've modeled it), that coasting with minimum regeneration (brake pedal not depressed) is more efficient than using the brakes even if one scores 100% brake score. But, I found the difference between the two of marginal value though for normal driving in my modeling. In other words, unless one is trying to set a hypermiling record, the value of not using the brakes in terms of increasing FE when one is getting 40 mpg is small (maybe a few % points increase in FE) if one has many, many frequent stops.
-
I have PMs off as in other forums I would get PMs with questions on what do I think is the issue, what should I do, what do you recommend and so forth. I felt obligated to respond and spent to much of my time researching issues. Post the codes so everyone knows what the codes are. :) ;)
-
The title of Navigant's press release: Conventional Gasoline Models are Expected to Represent Less Than Half of Vehicles Sold Worldwide by 2017 is very misleading. The operative word is "Conventional." The article is not about EV, CNG, LPG or biodiesel new vehicle sales (non-gasoline vehicles) surpassing sales of vehicles using gasoline by 2017. It's about changes to the "conventional" or "traditional" gas vehicle such that by 2017 less than 1/2 of new vehicle sales will be a traditional gas vehicle. Navigant considers practically any technology beyond old-school, naturally aspirated power to be outside its narrowly defined traditional category. So, a gas vehicle equipped with an engine start / stop feature would be considered a non-traditional gas vehicle and excluded from traditional gasoline sales by Navigant. So until, one knows what is considered "conventional", it's hard to dismiss the article per se. Of course one can buy the full research document and probably find out how Navigant came up with their misleading title. :)
-
You need to read the Ford New Car Limited Warranty (it's available on-line). Here's what I posted in another thread. The Ford Warranty covers the hybrid components for 8 yrs / 100 k miles (longer in CA). See below for Hybrid components covered. Major emission systems are covered for 8 /80 k miles (see below). The rest of the Power Train is covered for 5/60. So, if one is buying an extended warranty because of the new hybrid technology, it's already covered for 100 k miles. Quote
-
Sure sounds like the transmission or power train control modules are getting confused I would definitely take it to the dealer to check for codes. Also, can you check in the Engineering Test Mode (ETM) screen to see if there are any Diagnostic Trouble Codes stored? Unfortunately we have yet to find the "key" to translate them. This may help others in the future if DTCs are stored. Entering ETM with Keyed Ignition From Kotsby: Engineering Test Mode (ETM) is activated on the SE by holding down the left-steering-wheel OK button when turning the car from off to ignition-on and holding OK until the ETM display begins (a yellow ET is displayed in the upper left corner) of the left-hand screen). It is not necessary to actually turn the key another notch to "start" the vehicle. The only way to turn off ET is to turn the key off. Once activated, ET will continue on the left-hand display once the vehicle is started, covering the usual left-hand trip odometers, MyView, and Power screens. Entering ETM with Push Button Start 1) Push and hold the "OK" button on the left input pad on the steering wheel 2) DO NOT STEP ON THE BRAKE. Push the start button while still holding the "OK" button. 3) Engineering test mode will come up on the left hand screen. It might be blocked by another message but you can see the letters ET in the upper left. Release the "OK" button and push it again to clear the other message. 4) The Engineering Test Mode screen should be displayed. 5) Push the up or down arrows to scroll through the ETM screens. Here's what Ford says about the ETM DTC screen: DTC HIST CURRxxxxxx x xxxxxxx xDisplays all of the Diagnostic Trouble Codes (DTCs) set (history and current Diagnostic Trouble Codes [DTCs]). An X in the HIST or CURR column means the DTC is active. Three Diagnostic Trouble Codes (DTCs) display on each screen. If more Diagnostic Trouble Codes (DTCs) are present, there will be additional screens listing them. If there are no Diagnostic Trouble Codes (DTCs) in history or current, the display will only be the title row.
-
What is the EV meter on Engage actually showing?
plus 3 golfer replied to SPL Tech's topic in General Discussion
I believe the 2014 manual to be correct. The 2013 manual is likely in error. This would mean the metering is at the crankshaft for ICE and HVB for EV. From the Owner's Manual: 2014 Manual EnlightenEnlighten displays power demand in addition to the typical information and options from Inform. The Instantaneous Fuel Economy gauge will be displayed by default. When the vehicle is operating on battery power only with the engine off, EV is displayed EngageEngage replaces the power demand gauge from Enlighten with separate gauges for engine power and high voltage battery power. The engine power gauge fill is white and the high voltage battery power gauge fill is blue. When the vehicle is operating on battery power only with the engine off, EV is displayed. 2013 Manual Enlighten — Enlighten displays power demand in addition to the typical information and options from Inform. The Instantaneous Fuel Economy gauge will be displayed by default. When the vehicle is operating on battery power only, EV is displayed and the gauge fill is shown in blue. Engage — Engage replaces the power demand gauge from Enlighten with separate gauges for engine power and electric motor power. The engine power gauge fill is white and the high voltage battery power gauge fill is blue. When the vehicle is operating on battery power only, EV is displayed. -
CMax testing from Argonne National Laboratory
plus 3 golfer replied to jdbob's topic in General Discussion
Did you notice the B coefficient for the Prius V is negative. That's an example as to why I said one needs to be careful in ascribing a physical attribute of a vehicle to a specific coefficient. Sometimes, it makes sense and sometimes it doesn't. Another example is in my testing of grille covers for the C-Max. I posted in another thread that I found about a 7% improvement in the coefficient of drag (Cd) with grille covers on vs off when analyzing coast down data with and without the covers. So, if we assume that coefficient C is 100% related to aerodynamic drag, then we should expect a reduction of aero RLHP of 7% when using grille covers (C-Max Cd = 0.30 without grille covers and 0.279 with grille covers). At 60 mph from the table above, 7% reduction would be about 0.847 HP (0.07*12.1) or a reduction of about 4.4% in total RLHP (0.847/19.13). If we assume that this 4.4% is proportional to an increase in FE, we might get a FE improvement of 4.4% with grille covers at 60 mph. If our FE without grille covers is 50 mpg, it might be 52.2 mpg using grille covers due to reduced aero drag. :) Unfortunately, I can't say the same about gas pods. :sad: -
From the album: Plus 3 Golfer
-
CMax testing from Argonne National Laboratory
plus 3 golfer replied to jdbob's topic in General Discussion
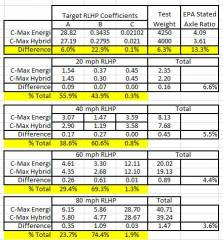
Correct. I've done coast down tests on my C-Max and one can fit coast down curves (time vs speed) that match the data at very, very high r squared levels. But, when trying to relate the curve to the Road Loads that affect the curve: rolling resistance (function of V), friction losses (function of V^2), and Aero losses (function of V^3) using known vehicle data (Cd, weight, frontal area) and external data (pressure, road surface, and so forth), the resulting coefficients may not totally represent a specific component of road load - for example, coefficient A may represent most of the rolling resistance and coefficient B a lesser portion of rolling resistance. As stated in the link, the derived road load coefficient that are incorporated into the road load, but coupled, are: •Aerodynamic forces•Rolling resistance•Friction loses So, we just need to be careful in ascribing changes between vehicles to a specific coefficients due to the coupling. Here's a table showing the RLHP for the Energi and Hybrid at various speeds. To me the data makes sense given the difference in weight and final drive ratios. The difference in final drive ratios should increase friction losses in the Energi over the Hybrid transmission - MG1 and MG2 spin when coasting. Coefficient C should represent virtually all aerodynamic drag and should be virtually the same between the C-Max and Energi and it is. But what we don't know is how much of the changes in coefficients A and B relate to weight and how much relate to friction losses - what's the coupling between the two (if any) in the coast down data. -
CMax testing from Argonne National Laboratory
plus 3 golfer replied to jdbob's topic in General Discussion
Read this as it gives a fairly complete insight into dyno testing. I don't think one can compare "fairly" one component of the RLHP coefficients among vehicles. It's the total RLHP that's comparable. One can guess as to why certain coefficients are higher or lower. Units are mph for V. Here's the target coefficients (which are the C-Max HEV Aug. 2013 coefficients) used for the C-Max HEV testing in the link I provided. I believe the OP's link is a summary of the tests in the Argonne link in this post. Target A [lb] 21.75 Target B [lb/mph] 0.365 Target C [lb/mph^2] 0.01859 -
CMax testing from Argonne National Laboratory
plus 3 golfer replied to jdbob's topic in General Discussion
The latest Energi RLHP target coefficients are; 28.82, 0.345 and 0.02102 This data is not shown on the graph but would put the Energi curve slightly higher than the C-Max hybrid. The curve for the Energi shown in the graph is the original target coefficients that would be compared to the C-Max Hybrid HEV August Revision (solid dark blue line). Remember the original C-Max HEV curve is the curve for the Fusion HEV which is the reason the original HEV and PHEV curves are so far apart. -
CMax testing from Argonne National Laboratory
plus 3 golfer replied to jdbob's topic in General Discussion
Good questions. I wasn't focusing on the Energi. I'll have to look at what the Energi curve represents. Ford originally tested the C-max Energi for the initial EPA numbers and used those FE numbers for the Fusion Energi. So, there was no retest of the C-Max Energi in 2013. In 2014 ford discovered the Error in the RLHP coefficients and retested many vehicles as shown in the link below and got the latest EPA numbers. http://www.epa.gov/fueleconomy/updates.htm I forgot to mention that one must remember that the Energi final drive ratio is numerically higher than the Hybrid. This coupled with the Energi weighing more than the C-Max will result in lower EPA FE for the Energi which can be seen in the link. -
CMax testing from Argonne National Laboratory
plus 3 golfer replied to jdbob's topic in General Discussion
The original C-Max EPA rating of 47/47/47 was based on the Fusion Hybrid EPA tests. The Fusion has a drag coefficient of 0.27 but the C-Max drag coefficient is 0.30. So, the C-Max EPA mileage rating was overstated. But, there was a loophole in the EPA test procedures that allowed such to happen. A manufacturer could use one set of EPA test results for one vehicle for other vehicles that basically have the same engine. For example, the intent is to allow the manufacturer to run only one set of tests for the C-Max SE and SEL Hybrid and if the Lincoln / Mercury division had a C-Max like vehicle the test results could also be applied to the L/M vehicle. That's the second line in the table and solid red curve. Ford then actually tested the C-Max and reduced the EPA mileage rating in August 2013 but had yet discovered that the RLHP coefficients were in error. That's the first line in the table and the solid dark blue line in the graph. Then in 2014 Ford discovered that had used the wrong RLHP coefficients in several models including the C-Max. Ford retested and again lowered the EPA FE numbers (last line in the table and light blue solid line in the graph). I find it hard to believe that FORD (especially their engineers) didn't know what was going on with the EPA testing in 2012 and the fact the the RLHP numbers were incorrect. Anyone familiar with the EPA test procedures and how RLHP is determined and used should have questioned Ford's C-Max tests in 2012 and 2013 when compared to other hybrids. How does a heavier, less aerodynamic vehicle have better EPA FE than the Prius V. It's not magic, it's physics. -
It's the Battery Monitoring Sensor which monitors the state of charge of the battery and estimates losses in the battery capacity over time. Data is sent to BCM. BCM sends data to the PCM which determines the set point 12 V voltage for charging and sends to DC/DC converter.
-
Yes, you can see the codes when powering on the car in ETM. I've been trying to find a list of codes since I learned of ETM displaying DTCs. I have yet to find a listing of DTCs for Ford's consolidated diagnostic standards. Here's what I found from Ford. 1) Ford consolidated diagnostic standards by: "Adoption of the ISO 14229-1 diagnostic standard for all ECUs on CAN." 2) ISO 14229 sends two additional bytes of information with each DTC, a failure type byte and a status byte. 3) All ISO 14229 DTCs are four bytes long instead of three or two bytes long. Additionally, the status byte for ISO 14229 DTCs is defined differently than the status byte for previous applications with three byte DTCs. 4) The failure type byte is designed to describe the specific failure associated with the basic DTC. For example, a failure type byte of 1C means circuit voltage out of range, 73 means actuator stuck closed. When combined with a basic component DTC, it allows one basic DTC to describe many types of failures. 5) The PCM does not use failure type bytes and always sends a failure type byte of 00 (no sub type information). This is because OBD-II regulations require manufacturers to use two byte DTCs for generic scan tool communications. Additionally, the OBD-II regulations require the two byte DTCs to be very specific, so there is no additional information that the failure type byte could provide. 6) The status byte is designed to provide additional information about the DTC, such as when the DTC failed, when the DTC was last evaluated, and if any warning indication has been requested. Each of the eight bits in the status byte has a precise meaning that is defined in ISO 14229. 7) Here's what Ford says about ETM DTC HIST CURRxxxxxx x xxxxxxx xDisplays all of the Diagnostic Trouble Codes (DTCs) set (history and current Diagnostic Trouble Codes [DTCs]). An X in the HIST or CURR column means the DTC is active. Three Diagnostic Trouble Codes (DTCs) display on each screen. If more Diagnostic Trouble Codes (DTCs) are present, there will be additional screens listing them. If there are no Diagnostic Trouble Codes (DTCs) in history or current, the display will only be the title row.
-
ICE is started by MG1 via the HVB not by the 12V battery. The 12V battery provides power to the 12 V control modules and electronics. If the 12V battery voltage is above certain threshold levels, the car should be ready to drive when turned on via key or push button. If conditions require ICE to start it will start (accelerator pushed to floor for example). Bottom line is that 12V battery current will be virtually the same regardless of whether ICE starts or not. There is no high 12V cranking amps to start ICE in the C-Max as there is in a car with a conventional starter.